
Content Marketing Metrics That Actually Matter: What to Track and Report
Published: April 7, 2026 | 10 min read |
By Graeme Whiles
Here is a scene I have watched play out more times than I should have to. A content marketer walks into a reporting meeting with a deck full of traffic graphs trending upward, time on page improving quarter on quarter, social media engagement metrics looking healthy. Leadership asks one question: what is this generating for the business? The room goes quiet.
The problem is not the content. It is the measurement. Most content teams track what is easy to track rather than what demonstrates commercial value. Vanity metrics feel like progress. They are not business outcomes. And in 2026, there is a new layer of complexity: AI visibility trackers are proliferating, many of them built on sampled, inconsistently collected data that is not yet reliable enough to anchor a business reporting conversation.
This is the practical guide to the content marketing metrics that actually matter. How to track them, how to connect them to revenue, and how to present them in a way that survives a budget review.
I have run content measurement frameworks across enterprise and SaaS clients long enough to know which metrics keep content investment secure and which ones get programmes cut. The difference is not subtle.
Author Bio
Graeme Whiles is an independent SEO and AEO consultant at GWContent. He has worked with enterprise and SaaS brands including Originality.ai, Connecteam, 6sense, and Practice Better, growing organic traffic and AI search visibility across some of the most competitive categories in B2B. He also built Three Putt Golf Clothing from a blank domain as a live proof of concept for his methodology.
Short on time? Here are the key takeaways
-
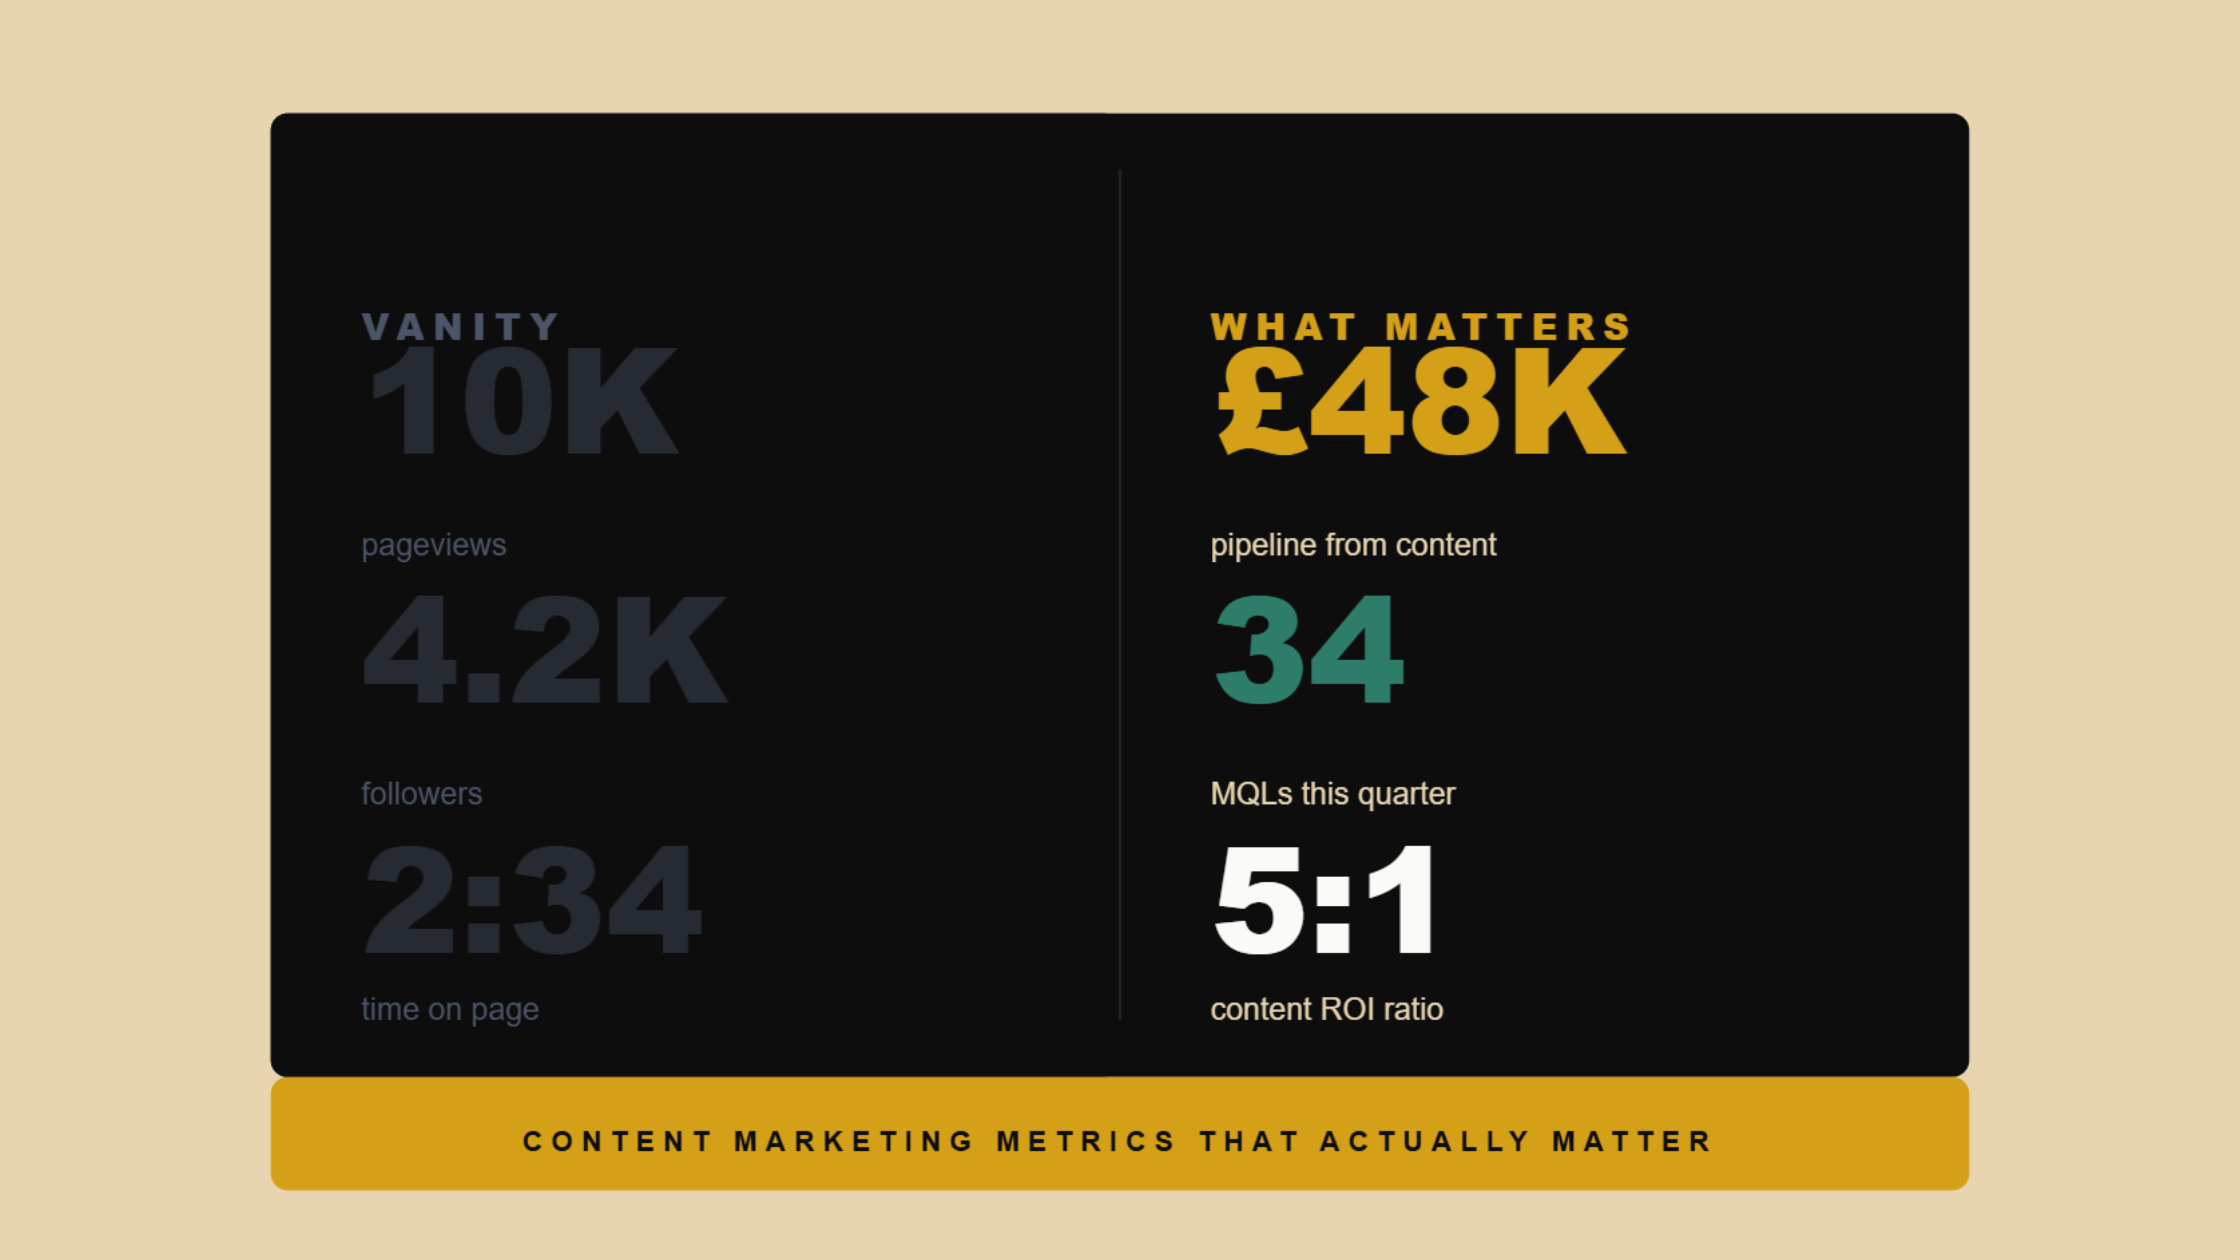
Vanity metrics like total pageviews and social media followers are content activity metrics, not business outcomes. The distinction matters enormously in a budget conversation.
-
Content marketing leaders experience nearly eight times more site traffic than non-leaders. But traffic is a leading indicator, not a result.
-
The metrics that prove content ROI connect to revenue: conversion rate, marketing qualified leads, customer acquisition cost, and content-attributed pipeline.
-
Different metrics matter at different stages of the buyer's journey. Awareness metrics and decision metrics are not interchangeable.
-
56% of marketers cite challenges in tracking customer journeys and attributing ROI to content efforts. Most are using the wrong attribution model, not the wrong tools.
Why Most Content Reporting Gets It Wrong
The content marketing industry has a measurement problem it has largely chosen not to solve. There is a long tradition of defending content investment with engagement metrics because connecting content activity to actual revenue is genuinely difficult work. That difficulty has created a culture of reporting what is easy rather than what is meaningful.
Not all content marketers set up their measurement stack before launching a content marketing campaign. The result is that marketing goals are defined retrospectively, which means the data collected rarely maps cleanly to the business goals it is supposed to support. This is where the disconnect between content effort and commercial outcome begins, and it is almost always a setup problem rather than a content quality problem.
The result is reporting stacks built almost entirely around web analytics that do not answer commercial questions. Total pageviews, bounce rate, social media presence statistics, average time on page. These have diagnostic value. None of them tell leadership what the content programme is producing for the business.
Then there is the AI tracker problem. A growing number of tools now claim to measure brand visibility in ChatGPT, Perplexity, and Google AI Overviews. Some offer useful directional signals. Many are based on sampled queries run at irregular intervals with no standardised methodology, which makes them unreliable as the basis for business reporting. A content marketer who builds their reporting dashboard on unvalidated AI visibility data is building on unstable ground, and one difficult question in a stakeholder meeting will expose it.
The right frame for content metrics is this: use vanity metrics and early-stage AI visibility data to diagnose what is working. Use commercial metrics to prove what it is producing. These are different jobs and they need to be kept clearly separate.
The brands I have seen lose their content budgets were almost universally reporting on the wrong things. The ones that keep and grow their investment report on conversion rate, qualified leads, pipeline contribution, and cost per acquisition. That distinction is the entire argument of this article.
The Metrics Framework: Buyer's Journey by Stage
Content performance cannot be measured with a single number because content serves different commercial purposes at different stages of the buyer's journey. Awareness content, consideration content, and decision content each have distinct goals and therefore distinct key metrics. Treating them the same is where most content marketing strategy measurement goes wrong.
The correct framework maps every important metric to the stage it serves. Organic traffic and keyword rankings at the awareness stage. Engagement metrics and lead generation at the consideration stage. Conversion rate and customer acquisition cost at the decision stage. Customer retention and brand loyalty signals in the post-purchase stage.
This framework also makes reporting to leadership more coherent. Rather than presenting a list of seventeen content metrics that collectively obscure the argument, you present a structured picture of how content is performing at each stage of the marketing funnel, with one or two key numbers per stage.
Awareness stage metrics
Organic traffic is the primary awareness metric: the volume of visitors arriving from organic search, tracked in Google Analytics and confirmed in Google Search Console. The useful version of this metric is organic traffic by page and by intent stage, not just as a site-wide total. A page receiving high organic search traffic for informational queries is performing differently to a page receiving organic search traffic for commercial-intent queries, and reporting them together obscures both.
Keyword rankings show where content is appearing in search engine results pages for target keywords. Google Search Console is the most reliable source for this data. Improving keyword rankings precede organic traffic growth, which makes them a useful leading indicator of future performance rather than a lagging one.
Google Search Console impressions show how many times content appeared in search results regardless of whether it was clicked. Growing impressions signal expanding brand awareness and building brand recognition even before traffic converts. The click through rate from impressions to clicks tells you whether titles and meta descriptions are compelling enough to earn the click. Both matter for understanding SEO performance and blog traffic at the top of the funnel. Building brand awareness through organic search requires both visibility and earned clicks. One without the other is an incomplete picture.
Important caveat: awareness metrics are leading indicators. Reporting them to leadership without connecting them to what they are leading to is one of the most reliable ways to lose a content marketing budget.
Consideration stage metrics
Engagement rate in Google Analytics 4 is defined as sessions that last longer than ten seconds, include a conversion event, or include two or more pageviews. A high engagement rate suggests content is prompting active responses from the audience rather than passive scanning. This replaced bounce rate as the primary engagement signal in GA4 and is more useful for content marketers because it captures positive engagement rather than just flagging exits.
Average time on page shows whether visitors are actually reading content or skimming it. Longer durations typically indicate higher user engagement and stronger content quality. But time on page is only meaningful in context: high time on page combined with zero conversion events is an engagement signal without a commercial outcome. Track both together, not independently.
Scroll depth tells you how far down the page visitors get, which is particularly useful for long-form blog content. A piece of content where 80% of visitors leave before reaching the call to action has a structural problem regardless of how long they spend on the part they do read.
Same session behaviour is also worth tracking: when the same user visits multiple pages in a single session, it signals active research rather than passive consumption. A visitor who reads three blog posts in one session and then hits a pricing page is a warmer prospect than one who reads a single post and leaves. Google Analytics 4 captures this in user journey reports, and it is one of the most underused signals in content marketing measurement.
New versus returning visitors: returning visitors and direct traffic from repeat users signal that content is building brand loyalty and creating a reason to come back. For B2B content in particular, where the buyer's journey spans weeks or months across multiple touchpoints, the proportion of returning visitors is a meaningful signal of relationship-building rather than one-off traffic generation.
Decision stage metrics
Conversion rate is the percentage of visitors who complete a defined conversion event after consuming content: form fills, demo requests, free trial signups, or email list subscriptions. The average conversion rate for content marketing is around 2.9% according to industry research, but this varies significantly by content type and conversion event definition. The useful version of this metric is conversion rate per page, not a site-wide average that masks the performance difference between a pricing page and a top-of-funnel blog post.
Marketing qualified leads are the data point the sales team actually cares about. Tracking how many leads content generates is only half the job. Content efforts that generate large numbers of unqualified leads are not producing the business outcome they appear to be producing. Customer retention data tells a related story: content that acquires the wrong customers produces higher churn rates, which destroys the lifetime value argument for that content investment. High quality leads from content, defined by lead scoring and CRM data, are more commercially valuable than high volume leads from broad awareness content.
Customer acquisition cost via content is the total cost of acquiring a customer through the content programme divided by the number of customers acquired. The most compelling CAC argument for content is the trend line: content CAC falls as the asset base compounds, because existing content keeps generating leads at a declining marginal cost. Paid CAC stays flat or rises. Showing that comparison clearly in a reporting deck makes the sustained investment case more persuasive than any traffic graph.
Content-attributed pipeline is the total value of deals in the CRM where a content touchpoint is logged before the deal closes. This requires connecting web analytics to CRM data, but it is the single most persuasive metric for proving content ROI to leadership. Revenue generated through content, demonstrated with named pipeline data, is the metric that wins budget conversations. Everything else is context.
The Metrics That Look Important But Are Not

These are not useless metrics.
They are useful for diagnosing content performance, but they are not useful for proving the value of a content marketing programme in a business reporting context.
The vanity metrics trap
Total pageviews tell you how many times pages were loaded. They do not tell you whether those visitors were in the target audience, engaged with the content, or took any action. A piece of content generating 50,000 pageviews at zero conversion is commercially worthless regardless of the impressive traffic headline. Reporting it to leadership as a content marketing success creates a credibility gap that surfaces at the worst possible moment.
Social media engagement metrics and social media presence follower counts measure audience size and activity, not commercial output. A large following that does not generate website traffic, leads generated, or pipeline is a distribution asset without commercial return. Track social media engagement as a signal of content resonance. Do not use it to prove content marketing effectiveness in a budget conversation.
Time on page in isolation: high average time on page is a positive signal. But visitors who spend four minutes on a page and then leave without taking any action have not produced a business outcome. Time on page needs to be read alongside conversion rate and lead generation data to mean anything commercially useful.
Bounce rate is useful as a diagnostic signal, not a headline metric. A high bounce rate on a blog post that answered a specific question and sent the visitor away satisfied is not a problem. A high bounce rate on a landing page designed to generate leads is a critical metric that needs immediate attention. Context determines whether the number is meaningful or misleading.
Keyword rankings without traffic connection: ranking in position three for a target keyword that generates zero clicks because the query has no search volume is not a success story. Rankings need to connect to impressions, then to organic search traffic, then to conversion events to represent genuine content performance.
The AI visibility tracker problem
AI visibility matters. It is a growing and legitimate dimension of content performance as more of the queries your target audience runs are resolved inside ChatGPT, Perplexity, and Google AI Overviews rather than traditional search results. What does not yet exist is a reliable, standardised, independently validated method for measuring it.
Brand perception in AI-generated responses is a specific and undertracked risk: not just whether your brand appears, but whether what the AI says about you is accurate and favourable. That is a content and E-E-A-T problem, not a tracking problem. Most AI visibility tools do not measure this dimension at all.
Most third-party AI visibility trackers run samples of queries at intervals, note whether a brand appears, and report a score. The sample sizes are often small, the query sets are often opaque, and the connection between a high AI visibility score and actual referral traffic or leads generated has not been established clearly enough to base business reporting on.
The honest approach: use the AEO Readiness Score to benchmark your site's current health across the content, schema, and E-E-A-T signals that influence AI citation. Manual testing in ChatGPT and Perplexity remains the most reliable method for understanding what AI tools actually say about your brand. Google Search Console AI Overview impression data is the most credible quantitative proxy currently available.
Do not report unvalidated AI visibility metrics to leadership as primary performance indicators. Present them as directional signals alongside more established metrics until the measurement methodology matures.
How to Track Content Marketing Metrics Properly

Setting up your measurement stack
Google Analytics 4 is the foundation. Track conversion events on every landing page, content page, and lead generation form. Connect GA4 to your CRM so content touchpoints are visible alongside deal data. Build custom reports for organic traffic by page, engagement rate by content type, and conversion rate by traffic source. The default GA4 reports are a starting point, not a reporting framework. Valuable content deserves a measurement setup that reflects what it is supposed to produce: configure event tracking for every meaningful user engagement action on every key page, not just pageviews.
Google Search Console is essential for organic search performance. Track impressions, clicks, average position, and click-through rate for every piece of content against the target keywords you are trying to rank for. Monitor AI Overview appearances where they appear in the performance data. My free SEO tools complement Search Console with additional content health and performance signals, including content decay detection and meta description performance.
Your CRM is where content performance connects to commercial outcomes. Log content touchpoints before deals close. Build a custom report for the content-influenced pipeline. This is the step that transforms content metrics from marketing data into business data, and it is the step most content teams skip because it requires alignment with the sales team. That alignment is worth the effort.
The SEO ROI Calculator can also be useful for roughly modelling what your content programme should be producing, which gives reporting a forward-looking dimension alongside historical performance data.
Measuring content performance by type
Blog content primary metrics: organic traffic by page, keyword rankings, engagement rate, scroll depth, and conversion rate to lead. Secondary metrics: backlinks generated and social shares. Track blog content performance monthly to identify traffic decay before it materially impacts lead generation.
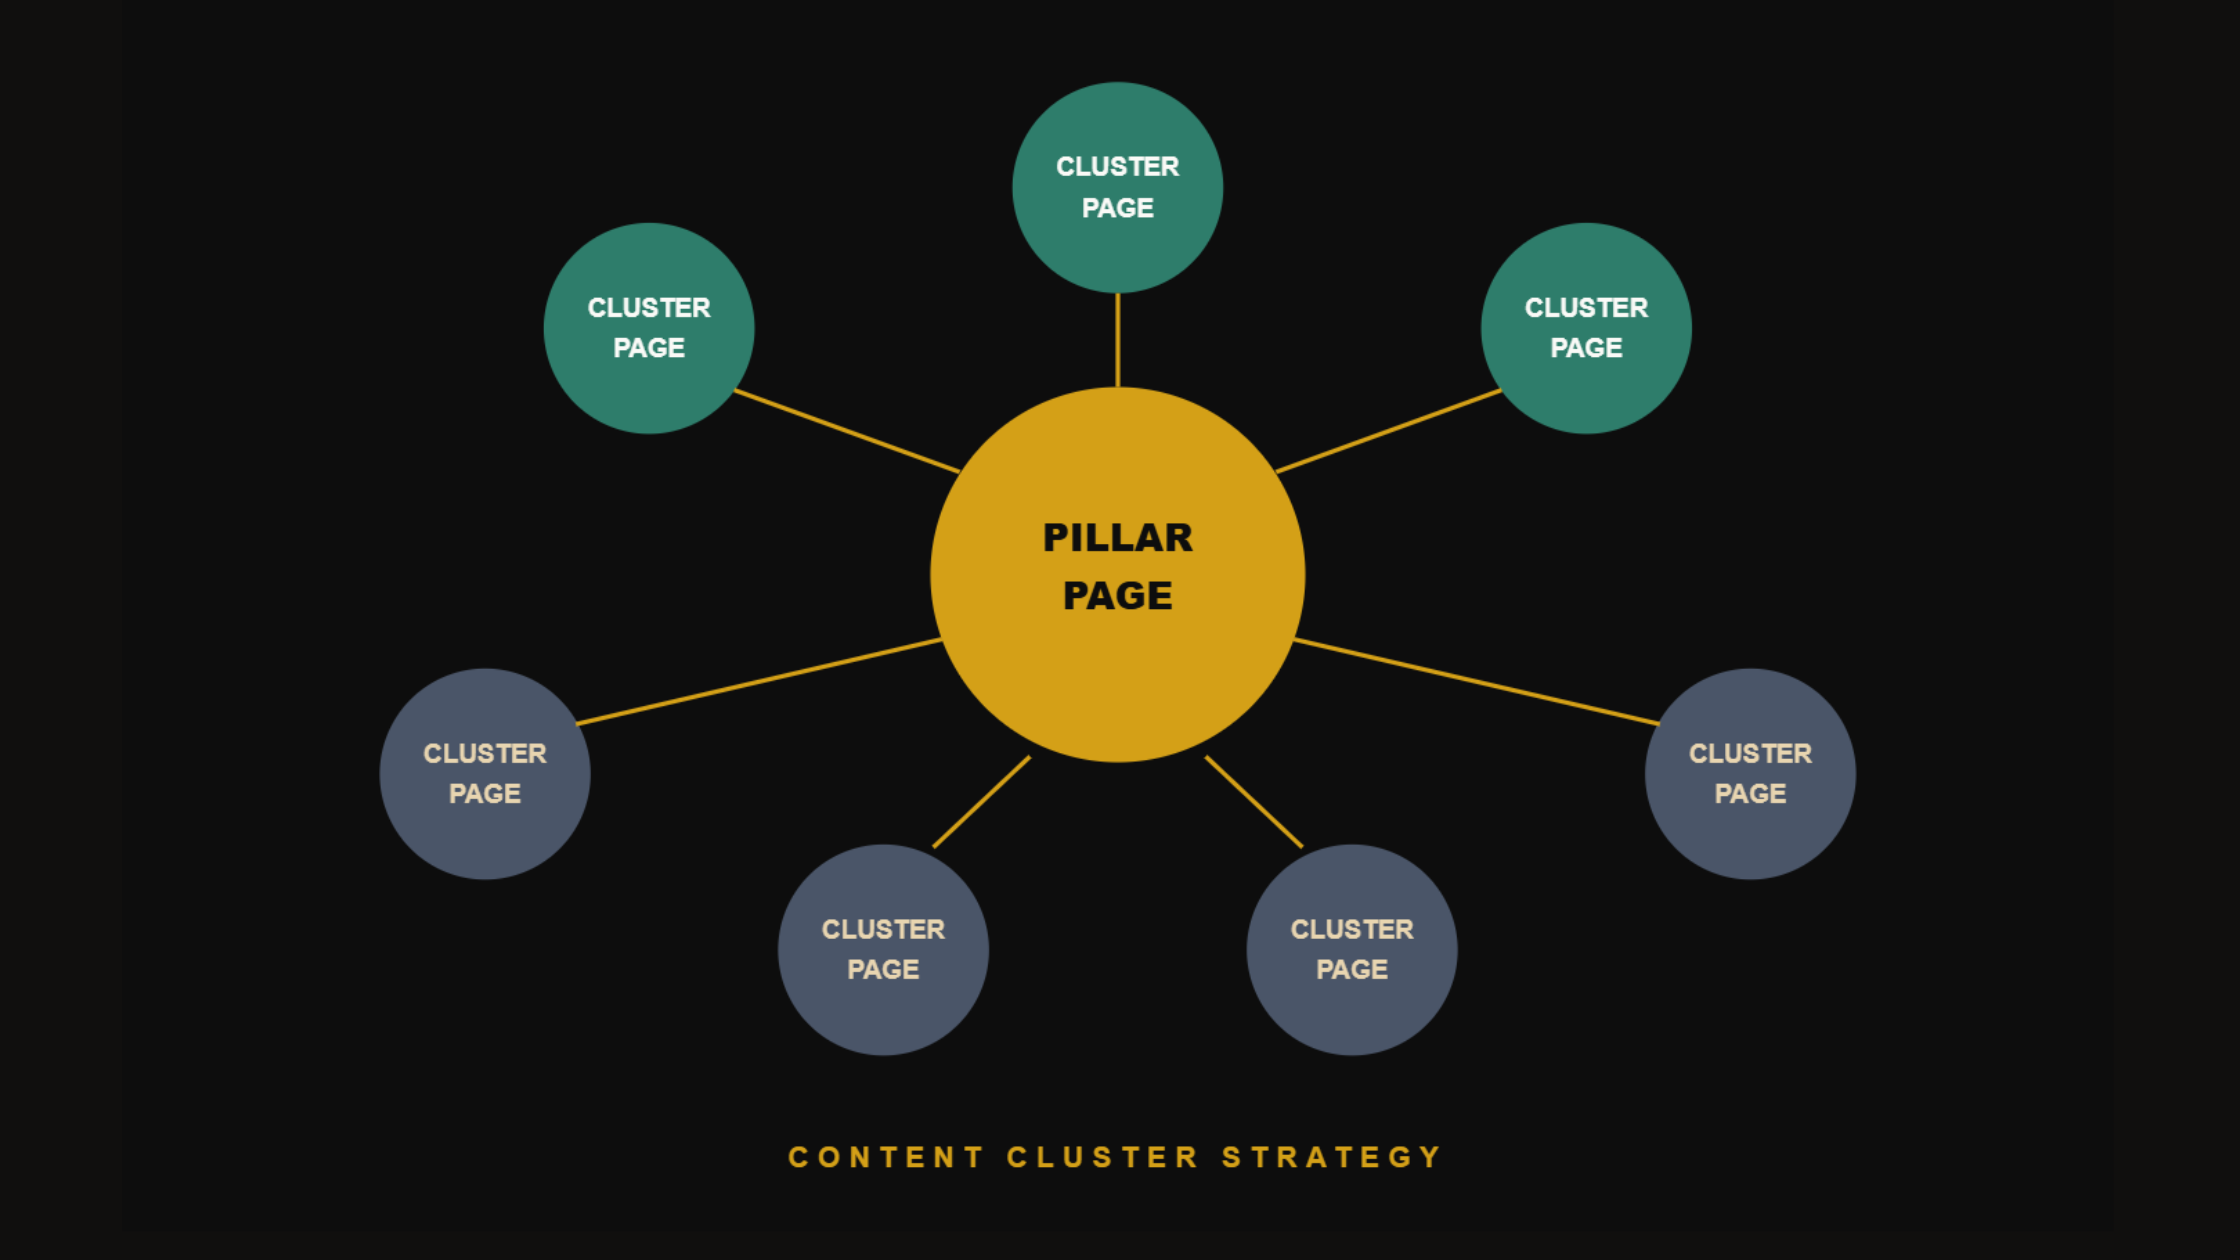
Measuring success for blog traffic specifically means going beyond total sessions to track which posts are generating leads, which are boosting engagement across the rest of the site through internal link clicks, and which are contributing to the overall marketing strategy through their position in the content cluster. That granular view is what allows content marketers to make genuinely useful decisions about where to invest future content creation resource.
The content marketing ROI guide covers the full ROI framework for connecting blog performance to revenue.
For Originality.ai, tracking organic traffic growth by page as the primary metric made the trajectory visible early. Traffic grew from 278,000 to 1.18 million sessions, a 324.7% increase, while referral domains grew from 1,098 to 9,942. The per-page performance data identified which content types and topic clusters were compounding fastest, which shaped every subsequent content creation decision. That is what measurement-informed content strategy looks like in practice. Read the Originality.ai case study.
Case study performance metrics: page views by referral source, time on page, and conversion rate from case study page to contact or demo request. Case studies are decision-stage content and should convert at higher rates than awareness content. If they are not, the problem is usually in the content structure rather than the traffic volume.
Social media posts: reach, engagement rate, and click-through rate to owned content. Useful as distribution performance signals. Not useful as primary content marketing metrics unless they can be connected to website traffic and lead generation.
Attribution: connecting content to revenue
Last-click attribution gives all conversion credit to the final touchpoint before purchase. In B2B, this is typically the demo request page or the sales call. Every piece of content consumed earlier in the buyer's journey gets zero credit. This is the most common reason content programmes are undervalued and eventually cut: the measurement model makes them invisible.
Multi-touch attribution distributes credit across all content touchpoints in the customer journey. This requires CRM integration and consistent touchpoint logging, but it produces a dramatically more accurate picture of what content is contributing to revenue. According to the Martial Group, 56% of marketers cite challenges in tracking customer journeys. The solution is not to stop trying. It is to start with the minimum viable attribution setup.
Understanding how many leads content is influencing at each stage of the pipeline, rather than only at the final conversion point, is what separates a mature measurement framework from a basic one. It is also what allows content marketers to make the case for creating content at stages of the buyer's journey that last-click attribution makes appear commercially invisible.
Practical first step: track content-influenced deals in your CRM, where at least one content touchpoint is logged before a deal closes. That single change reveals more about content performance than any web analytics report. Build from there toward a full multi-touch model as the data infrastructure matures.
For Connecteam, tracking AI Overview visibility as a specific metric alongside organic traffic revealed an opportunity that traffic measurement alone would have missed. AI Overview visibility grew from 3,522 to 6,320 keywords, a 79.4% increase, which informed the content strategy for subsequent phases. The measurement shaped the strategy. That is the correct relationship between the two. Read the Connecteam case study.
Building a Reporting Dashboard That Survives a Budget Conversation
The reporting dashboard that keeps content investment secure is not the one with the most metrics. It is the one with the clearest connection between content activity and business outcomes.
Four numbers: content-attributed revenue or pipeline, marketing qualified leads from content, customer acquisition cost via content versus paid channels, and organic traffic growth by intent stage. Present these four numbers with their trend lines and the comparison to paid channel performance. That is a budget conversation you can win.
Key performance indicators should be reviewed and reset annually to reflect changes in business goals and overall marketing strategy. A KPI that was right for a startup building brand awareness is not the right KPI for a growth-stage company optimising for pipeline contribution. Letting the wrong KPIs persist sends content teams in the wrong direction for months before anyone notices.
Report monthly to stakeholders. Include a brief note on which content pieces drove the most high quality leads that month, which pieces are showing traffic decay and are scheduled for refresh, and what the content programme is producing per pound invested versus alternative marketing efforts. Keep it to one page. Confidence comes from clarity, not volume.
A/B testing headlines, calls to action, and page layouts produces engagement data that directly improves conversion rate. Personalisation through audience segmentation can increase conversion rates by over 200% for specific calls to action according to Twilio and Segment research, which makes segmentation-driven content testing one of the highest-leverage applications of engagement metric data.
The compounding return on measurement: brands that use performance data to continuously improve existing content consistently outperform brands that use the same resource to create new content. Refreshing a high-impression, low-conversion page takes less resource than creating a new one and produces faster commercial returns. The content marketing for startups guide and B2B content marketing guide cover how this measurement discipline applies in different growth contexts.
The Bottom Line
There is a consistent pattern across every content programme I have run or audited. The ones that get cut measure the wrong things. The ones that grow measure the right ones and present them clearly.
The right metrics are the ones that connect content activity to business outcomes. Conversion rate. Qualified leads. Pipeline contribution. Cost per acquisition versus paid channels. These are the numbers that survive a CFO's scrutiny. Traffic graphs and social media engagement metrics do not.
Content marketing leaders experience nearly eight times more site traffic than non-leaders. The measurement discipline that gets you into that group is not sophisticated technology. It is the discipline to define conversion events before you publish, track content touchpoints in your CRM, report four credible numbers to leadership rather than seventeen ambiguous ones, and use the data to improve future content creation rather than simply defend past decisions.
The SEO ROI Calculator is the right starting point for modelling what your content programme should be producing commercially. The free SEO tools cover the operational measurement layer.
Get a free SEO audit and I will show you exactly what your content is producing right now and where the measurement gaps are costing you.
Frequently Asked Questions About Content Marketing Metrics
What are the most important content marketing metrics?
It depends on the stage of the buyer's journey that the content serves. Awareness stage: organic traffic, keyword rankings, and impressions from Google Search Console. Consideration stage: engagement rate, scroll depth, and returning visitor percentage. Decision stage: conversion rate, marketing qualified leads, and customer acquisition cost. Across all stages: content-attributed pipeline and revenue generated. These are the key metrics that connect content performance to commercial outcomes.
What is a good conversion rate for content marketing?
The average conversion rate for content marketing is around 2.9% according to industry research, but this varies significantly by content type and conversion event definition. Decision-stage content like case studies and pricing pages should convert at higher rates than awareness-stage blog content. Track conversion rate per page type rather than as a site-wide average to get data that is actually actionable.
How do I measure content marketing ROI?
Subtract total content cost from total revenue attributable to content, divide by total cost, and multiply by 100. Total cost must include labour, tools, promotion spend, and internal time. Revenue should include direct conversions, influenced pipeline, and content-assisted deals in your CRM. The content marketing ROI guide covers the full framework.
What is the difference between vanity metrics and performance metrics?
Vanity metrics measure content activity: pageviews, social media followers, and impressions. Performance metrics measure content outcomes: conversion rate, leads generated, content-attributed pipeline, and customer acquisition cost. Use vanity metrics to diagnose content performance issues. Use performance metrics to prove content value in business reporting.
How do I measure AI search visibility for content?
Manual testing remains the most reliable method: run target queries in ChatGPT and Perplexity in fresh sessions and note what is cited. Google Search Console tracks AI Overview impressions for Google. The AEO Readiness Score benchmarks your site's health across the signals that influence AI citation. Be cautious about third-party AI visibility trackers until their methodology is independently validated.
What content marketing metrics should I report to leadership?
Four: content-attributed revenue or pipeline, marketing qualified leads generated by content, customer acquisition cost via content versus paid channels, and organic traffic growth by intent stage. Present these with trend lines and comparison to paid performance. Four credible numbers outperform seventeen questionable ones in any budget conversation.
How do I connect content metrics to sales pipeline?
Log content touchpoints in your CRM before deals close. Build a report for a content-influenced pipeline where at least one content touchpoint appears before a deal closes. This requires alignment with the sales team and a consistent touchpoint logging process, but it is the single most persuasive data point for proving content value. Start with this minimum viable setup and build toward full multi-touch attribution over time.
